The financial markets are not driven by mere randomness; they are fueled by collective human psychology. Elliott Wave Theory is a sophisticated technical analysis framework that proves market participant sentiment moves in predictable, repetitive cycles. Rather than focusing on simple price action, it decodes the underlying emotional waves of fear and greed.
To successfully count waves and build a profitable trading strategy, investors must internalize specific ironclad rules and guidelines. This comprehensive guide details the core principles, structural characteristics, and strategic rules required for elite wave interpretation.
1. The Core Structure of Elliott Waves: Absolute Rules and Conditional Guidelines
At its foundation, a complete Elliott Wave cycle consists of an 8-wave structure: a 5-wave motive (impulse) phase that drives the primary trend, followed by a 3-wave corrective phase (A-B-C) that consolidates the gains. When a market transitions from a long-term bearish trend to a bullish reversal at a major bottom, this structure begins to unfold.
To ensure a wave count is valid, three absolute rules must never be broken. If even one is violated, the current wave count is incorrect and must be recalculated.
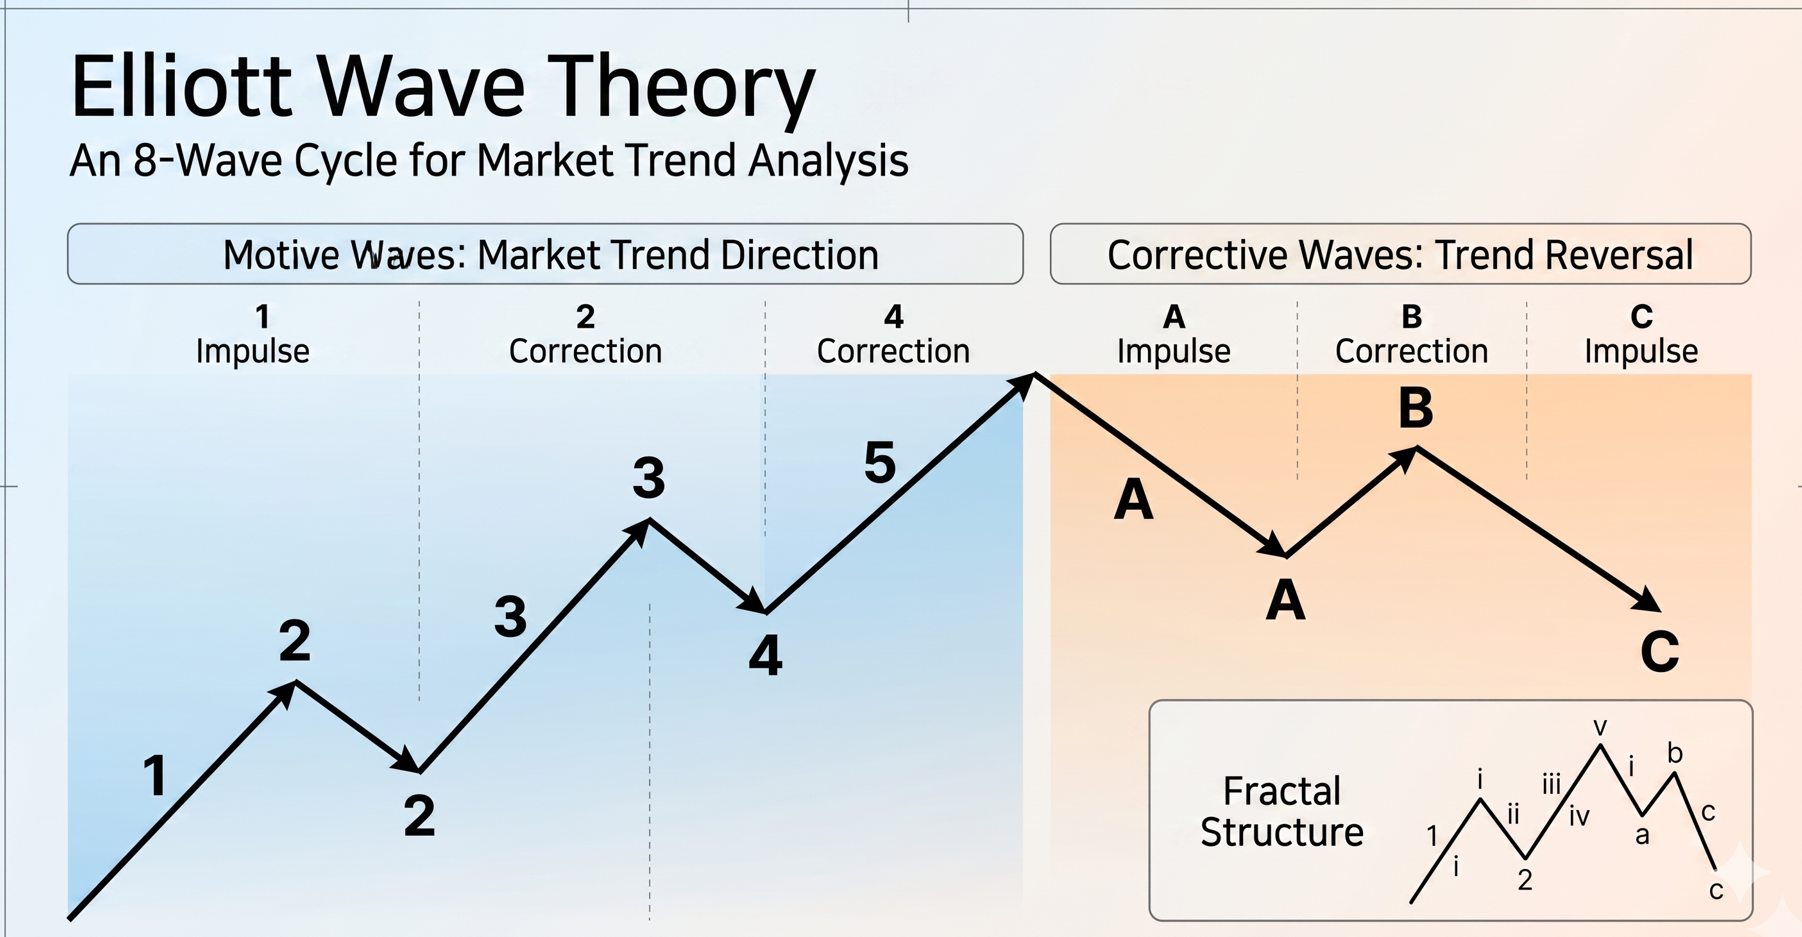
The Three Absolute Rules of Impulse Waves
- Rule of 2 (Wave 2 Retracement): Wave 2 can never retrace more than 100% of Wave 1. The starting point of Wave 1 is the absolute invalidation line.
- Rule of 3 (Shortest Wave Restriction): Wave 3 is never the shortest among the three actionary waves (Waves 1, 3, and 5). It is typically the longest, most explosive wave.
- Rule of 4 (Overlap Restriction): Wave 4 must never enter the price territory of Wave 1. The low of Wave 4 must remain strictly higher than the peak of Wave 1. (Note: In highly liquid markets, the bottom of Wave 4 frequently finds strong support at the internal minor fourth-wave low of the preceding Wave 3).
The Fractal Nature and Sub-Wave Division
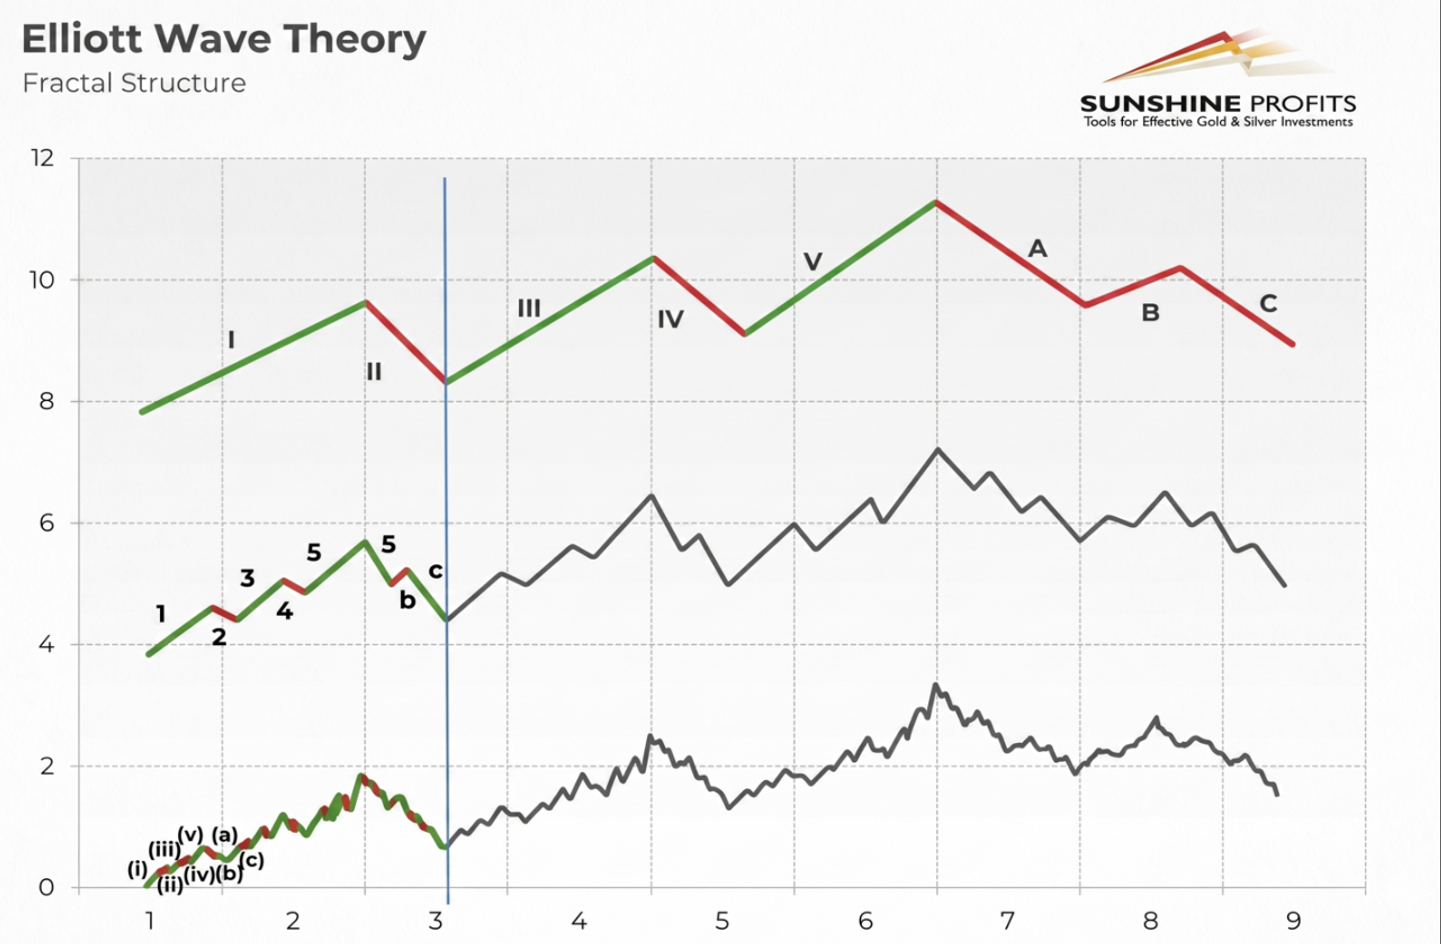
Elliott Waves are fractals, meaning they are self-similar structures that repeat across all timeframes. Every large wave is made up of smaller sub-waves, which in turn are made up of even smaller micro-waves.
- During an Impulse Trend: Waves 1, 3, and 5 (motive) break down into 5 smaller sub-waves. Waves 2 and 4 (corrective) break down into 3 smaller sub-waves.
- During a Corrective Trend (A-B-C): The classical setup is a 5-3-5 structure known as a Zigzag.
- The "Wave B" Identification Tip: When a trader is uncertain whether a market bounce is the start of a new Wave 5 or just a corrective Wave B, they should analyze the sub-waves. If the internal structure contains only 3 sub-waves, it is a Wave B corrective trap, not a structural rally.
- Macro Chart Characteristics: On higher-timeframe charts like monthly or yearly bars, a major primary impulse phase typically displays 5 distinct, large-scale bullish candles reflecting institutional capital inflows.
2. In-Depth Profiles of Impulse Waves and Fibonacci Proportions
Each wave possesses a unique personality, volume signature, and structural expectation defined by Fibonacci ratios.
Wave 1: The Institutional Footprint
- Internal Structure: Must consist of 5 clear sub-waves.
- Market Psychology: This wave represents smart money or institutional accumulation at the absolute market bottom. Because the sentiment remains heavily bearish from the prior crash, retail investors cannot detect it, often dismissed as a dead-cat bounce.
- Technical Validation: If the subsequent pullback drops below the absolute origin point of Wave 1, the count is instantly invalidated. True structural bottoms often form recognizable Inverse Head and Shoulders chart patterns.
Wave 2: The Shakeout
- Fibonacci Retracement: Wave 2 typically retraces deep into Wave 1, finding support around the 38.2% or 61.8% Fibonacci levels.
- Common Patterns: It usually manifests as a sharp Zigzag or a choppy Flat pattern, consisting of 3 corrective sub-waves.
- The Triangle Exception: On rare occasions, a Wave 2 can take the shape of a corrective Triangle. When this occurs, the internal structure expands into an A-B-C pattern (5 sub-waves), where each individual leg is strictly subdivided into 3 micro-waves.
Wave 3: The Power Engine
- Fibonacci Extension: Wave 3 is the most powerful phase. It regularly extends to a minimum of 1.618 times the length of Wave 1, and can stretch to 2.618 or higher in strong bull markets.
- Wave Extension Structure: When an extension occurs, the internal '3 of 3' sub-wave subdivides into another highly visible 5-wave micro-structure, generating an explosive vertical price climb.
- Technical Indicators: Volume reaches its absolute peak during this wave. Momentum oscillators such as MACD, RSI, and Stochastic indicators hit their highest readings of the entire cycle, confirming massive buying pressure.
Wave 4: The Profit-Taking Consolidation
- Fibonacci Retracement: Wave 4 tends to be a shallow correction, typically retracing roughly 38.2% of Wave 3's total height. It frequently clusters around the support zone of the minor sub-wave 4 hidden inside Wave 3.
- The Rule of Alternation: Wave 4 will look entirely different from Wave 2. If Wave 2 was a sharp, rapid, and simple Zigzag, Wave 4 will be a drawn-out, complex, and sideways consolidation—most commonly a Triangle pattern.
- Triangle Mathematical Guideline: Inside a Wave 4 contracting triangle, each successive sub-wave ( A,B,C,D,E ) tends to measure precisely 61.8% of the preceding sub-wave's length.
Wave 5: The Retail FOMO Peak
- Fibonacci Target: The length of Wave 5 often equals the length of Wave 1, or stretches to 61.8% of the entire distance traveled from the start of Wave 1 to the top of Wave 3.
- Volume and Technical Divergence: Volume during Wave 5 can spike significantly due to retail FOMO (Fear Of Missing Out), pushing the RSI deep into overbought territory (above 70). However, the absolute volume and momentum rarely surpass Wave 3.
- Bearish Divergence: Price achieves a higher high than Wave 3, but momentum indicators like the MACD histogram or RSI print lower highs. This structural Bearish Divergence is the ultimate warning of a major market top.
- The Truncation Exception (Truncated 5th): If Wave 3 was exceptionally overextended, Wave 5 may fail to break above the peak of Wave 3. This is known as a Truncation (or truncated 5th). Even when truncated, its internal structure must still cleanly display 5 sub-waves.
3. Profiles of Corrective Waves (A, B, C)
When the 5-wave motive trend concludes, the market enters a corrective phase designed to flush out late-stage retail buyers.
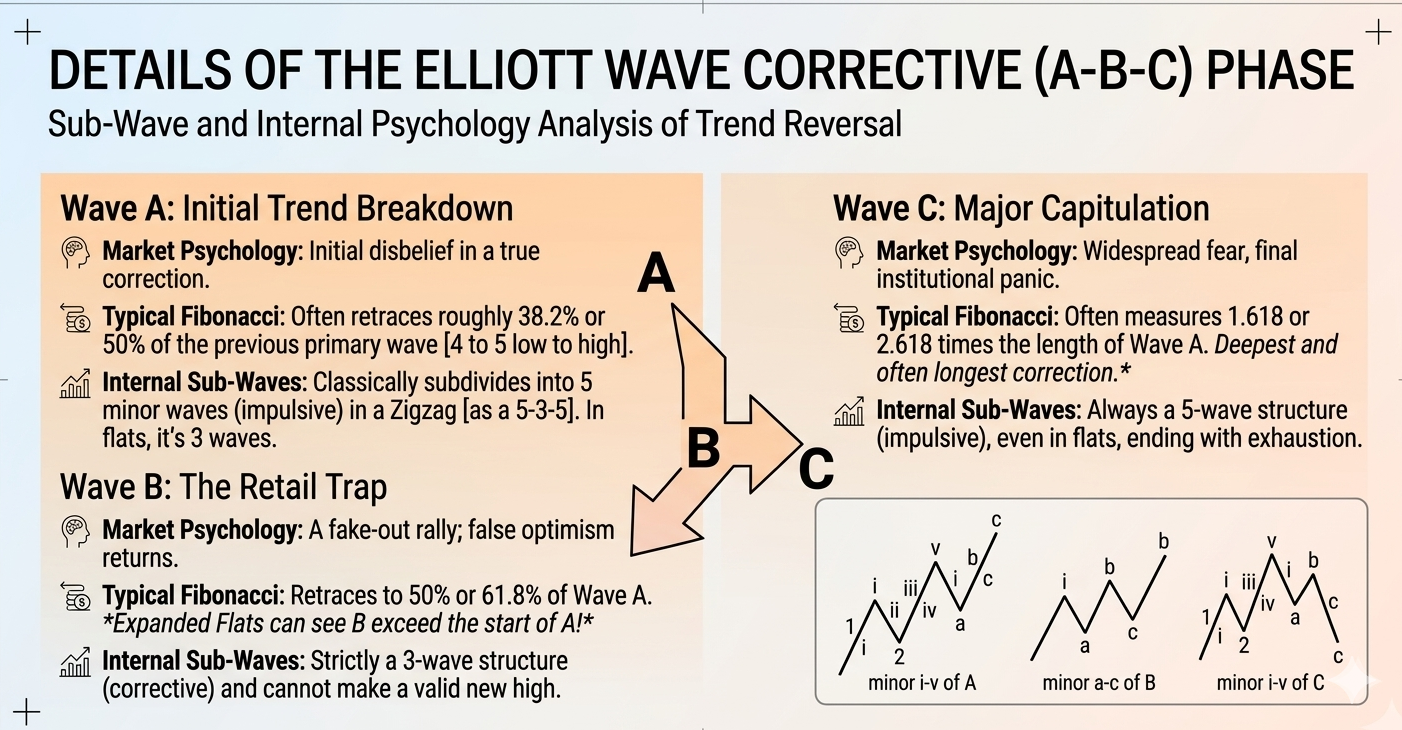
Wave A: The Silent Inversion
- Characteristics: Wave A marks the beginning of the correction. It typically splits into 5 impulsive sub-waves, catching the market off-guard. In rarer structural setups, such as a Flat or Expanded Flat correction, Wave A can present as a 3-wave structure.
- The 21-Sub-Wave Verification Tip: To verify if a market turn is truly a corrective Wave A rather than a minor intraday dip, professional analysts count the sub-waves of the preceding bull run. If the entire prior impulse leg cleanly contains all 21 micro sub-waves, it signals structural completion, confirming that Wave A is underway.
Wave B: The Bull Trap
- Fibonacci Targets:
- In a standard Zigzag correction, Wave B bounces back up to retrace 38.2%, 50%, or 61.8% of Wave A.
- In an Expanded Flat (Irregular) correction, Wave B aggressively surges past the starting point of Wave A, reaching 1.23 or 1.38 times the length of Wave A to trap short sellers before reversing violently.
- Core Rule: Regardless of the pattern, Wave B must always consist of exactly 3 sub-waves. This 3-wave signature is the definitive clue that the rally is a deceptive trap.
Wave C: The Capitulation Phase
- Fibonacci Targeting: Wave C is typically a devastating sell-off that measures 1.618 times the total length of Wave A.
- Structural Behavior: During an irregular or expanded flat correction, Wave C regularly opens with massive downward gaps and accelerating volume. It subdivides into 5 aggressive downward sub-waves. The final sub-wave (minor wave 5 of C) represents pure market panic and capitulation, making it the most critical zone for investors to avoid catching falling knives.
4. Key Behavioral Rules: Equality and Alternation
To improve counting accuracy, traders must apply two structural guidelines that dictate how waves balance one another.
The Rule of Wave Equality
If Wave 3 is the extended, longest wave (which occurs in over 80% of liquid markets), Wave 1 and Wave 5 tend to approach equality in both price distance and time duration. If you map out the exact length of Wave 1, you can project a highly reliable price and time target for the termination of Wave 5.
The Rule of Alternation
Wave 2 and Wave 4 will almost never look alike. They alternate across multiple dimensions:
- Time/Duration: If Wave 2 is a swift, short-lived drop, Wave 4 will be a prolonged, time-consuming sideways grind.
- Complexity: If Wave 2 is a simple, straightforward price retracement, Wave 4 will be a highly complex structural pattern.
- Shape: If Wave 2 takes the shape of a classic sharp Flat or Zigzag, Wave 4 will cycle into a Contracting/Expanding Triangle or a complex combination structure (W-X-Y).
5. Timeframe Analysis and Practical Limitations
While Elliott Wave Theory is a powerful structural tool, its effectiveness depends entirely on the asset class and the timeframe analyzed.
Strategic Market Environments for Accurate Counting
Elliott Wave patterns rely on mass psychology. Therefore, the theory works best under the following conditions:
- High-Liquidity Mega-Cap Stocks: Assets with massive market capitalization and heavy institutional volume reflect true collective psychology. Low-volume penny stocks are easily manipulated and will break wave rules.
- Strongly Trending Markets: Waves are easiest to count when a market is locked into a clear macro trend (bullish or bearish), rather than during long, multi-month market indecision.
- Higher Timeframes (Weekly and Monthly): Short-term intraday charts (1-minute or 5-minute frames) are full of algorithmic noise and random volatility. High-timeframe charts filter out this noise, allowing the true structural waves of the market cycle to emerge clearly.
The Misconception of the "Fixed 3-Year Cycle"
A common mistake among retail traders is assuming an Elliott Wave cycle has a fixed timeline, such as an average duration of 3 years (ranging from 1 to 5 years). This is an incorrect application of the theory.
- Time Flexibility: Elliott Wave Theory is strictly a price-pattern and structural framework, not a time-cycle predictor.
- Variable Scales: A complete 8-wave cycle can fully execute within a 5-minute window on an intraday chart, or take over 50 years to develop as a Grand Supercycle on a multi-decade macro chart.
- The Root of the Misconception: The idea of a 3-to-5-year cycle exists because macro wave structures often align with real-world macroeconomic business cycles and interest rate shifts. However, time duration is flexible, and traders should never force a wave count based on a calendar deadline.
6. The Golden Rules for Successful Wave Trading
To survive and profit using Elliott Wave Theory, execute your trades using these four mandatory parameters:
- Never Trade Without Confirmation: Do not guess where a wave ends. Wait for sub-waves to complete, chart patterns to break out, and volume indicators to validate the turn before entering a position.
- Define Invalidation Levels Instantly: Every trade setup must have a clear invalidation price. If you buy at what you believe is the start of Wave 3, your stop-loss must sit just below the origin of Wave 1. If that level breaks, accept that your count was wrong, exit the trade immediately, and re-analyze.
- Combine Waves with Other Technical Indicators: Elliott Wave analysis should not be used in isolation. Always cross-reference your wave counts with key support/resistance zones, moving averages, candlestick patterns, and macro volume profiles.
- Accept Structural Flexibility: The market is a living entity. A structure that looks like a clean impulse wave can rapidly morph into a complex correction. Remain objective, leave your bias at the door, and adjust your wave counts as new price data prints.
Disclaimer: The information provided in this post is for educational and reference purposes only. It does not constitute formal financial or investment advice. All investment decisions carry risk, and the final responsibility and judgment for any financial trades rest entirely with the individual investor.
💡 이 글의 한글 버전은 [여기]에서 확인하실 수 있습니다."
Recommended Reading:
From Janitor to Multi-Millionaire(Ronald Read's Secret, Power of Compounding)
From Janitor to Multi-Millionaire(Ronald Read's Secret, Power of Compounding)
The world of investing often conjures images of high-frequency traders, complex algorithms, and Wall Street suits. However, one of the most successful investors in history didn't work at a hedge fund. He was a gas station attendant and a janitor named Rona
lean-tech-guide65.tistory.com
'경영-직업' 카테고리의 다른 글
| Technical Analysis with the Ichimoku Balance Chart (0) | 2026.06.05 |
|---|---|
| 미국 백만장자들의 7가지 공통점 (1) | 2026.06.01 |
| Mastering Chart Slope Analysis: The Blueprint for Spotting Breakout Stocks and Perfecting Entry Timed (0) | 2026.05.25 |
| [주식 투자 Tip] 주가 차트 슬로프(Slope) 분석과 매매 타이밍 (0) | 2026.05.25 |
| 엘리엇 파동 3편(기본 구조, 주기 분석, 성공 투자 원칙) (0) | 2026.05.22 |